
July 17, 2021
The 48th meeting of the General Assembly (GA) of the Presbyterian Church in America (PCA) was held in St. Louis, Missouri, between June 29 and July 2 of this year. With 2,115 registered commissioners, it was the largest GA in the history of the PCA. As a time-honored Presbyterian tradition, elders and members of the PCA spend time analyzing and dissecting the floor debates and actions of the GA, but another honored pastime is discussing the registered attendance of elders, the relative number of Ruling Elders (RE) commissioners compared with Teaching Elder (TE) commissioners, and other topics related to the size and representation of elders at the annual meeting of the church. The increase in the number of commissioners at the 48th GA when compared to the 47th was 31%. While not “unprecedented” (to use a well-worn word of the COVID-19 pandemic era), the 31% increase did represent the largest one-year increase in growth since the 18th GA held in Atlanta, Georgia. The 48th GA was originally scheduled for the summer of 2020, but it was not held at that time due to COVID-19. Whether it would meet in 2021 was also in question until it seemed clear in February that the St. Louis government’s COVID restrictions would allow the gathering to proceed. Speaking as one commissioner, I experienced tremendous gratitude and joy in seeing the elders of the church coming together in such large numbers to do the work of the church.
Research Method and Future Reports: This report will provide only a glimpse into the commissioner numbers at the GA from the 1st meeting to the 48th meeting. Other reports will be forthcoming that will examine issues such as the breakdown of attendance of commissioners by state, Presbytery affiliation, church size, and other demographics. The breakdown of attendance by TE and RE commissioners will also be a feature of future reports. This report is a continuation of an attendance report published following the 46th GA (2018). While the research methods used for this report were straightforward, for those who are interested in the details, please refer to this document that describes the methodology. In short, however, the commissioner numbers, location of the GAs, and other variables for the 1st through 47th GA were taken from the minutes of the GA found on the PCA Historical Center website. The numbers for the 48th GA were taken from the On Site Attendance Report available to commissioners. The final commissioner numbers for the 48th GA will be included in the minutes available on the PCA Historical Center website later this year.
Change in GA Commissioner Attendance Over Time: A graphical representation of the percent change in commissioners over the history of the PCA (See Figure 1) shows which GAs had the highest increase and decrease in registered commissioners from the previous assembly. A complete data presentation is available in Table 1 below, but Figure 1 shows the data at a glance. The 48th GA, while the largest in commissioner numbers, was not the largest in terms of the increase in commissioner counts from the prior assembly. The commissioner registrations at the 10th and 18th GAs were over 50% higher than the prior years. An examination of the possible reasons for the increases in these and other years will be provided in a future report at fpramsay.org, but for now, please review the data presentations below, and provide your comments at Leave a Reply box at the bottom of this page or email me.
Figure 1: Percent Change in General Assembly Commissioners from the Prior Year from the 2nd through the 48th GA.
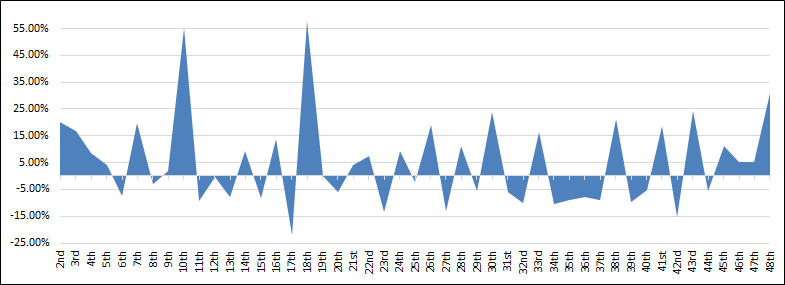
Table 1: Presbyterian Church in America General Assemblies, Commissioner Counts, and Percent Change from the Prior Year.
Readers can obtain versions of this table in either Excel or PDF at the links provided.
| General Assembly Number and Year | City | State | Number of Commissioners | Percent Change from Prior Year |
| 1st 1973 | Birmingham | AL | 387 | |
| 2nd 1974 | Macon | GA | 465 | 20.16% |
| 3rd 1975 | Jackson | MS | 543 | 16.77% |
| 4th 1976 | Greenville | SC | 590 | 8.66% |
| 5th 1977 | Smyrna | GA | 614 | 4.07% |
| 6th 1978 | Grand Rapids | MI | 569 | -7.33% |
| 7th 1979 | Charlotte | NC | 681 | 19.68% |
| 8th 1980 | Savannah | GA | 660 | -3.08% |
| 9th 1981 | Fort Lauderdale | FL | 673 | 1.97% |
| 10th 1982 | Grand Rapids | MI | 1,045 | 55.27% |
| 11th 1983 | Norfolk | VA | 948 | -9.28% |
| 12th 1984 | Baton Rouge | LA | 945 | -0.32% |
| 13th 1985 | St. Louis | MO | 871 | -7.83% |
| 14th 1986 | Philadelphia | PA | 951 | 9.18% |
| 15th 1987 | Grand Rapids | MI | 873 | -8.20% |
| 16th 1988 | Knoxville | TN | 993 | 13.75% |
| 17th 1989 | La Mirada | CA | 774 | -22.05% |
| 18th 1990 | Atlanta | GA | 1,220 | 57.62% |
| 19th 1991 | Birmingham | AL | 1,218 | -0.16% |
| 20th 1992 | Roanoke | VA | 1,145 | -5.99% |
| 21st 1993 | Columbia | SC | 1,191 | 4.02% |
| 22nd 1994 | Atlanta | GA | 1,280 | 7.47% |
| 23rd 1995 | Dallas | TX | 1,108 | -13.44% |
| 24th 1996 | Fort Lauderdale | FL | 1,212 | 9.39% |
| 25th 1997 | Colorado Springs | CO | 1,185 | -2.23% |
| 26th 1998 | St. Louis | MO | 1,411 | 19.07% |
| 27th 1999 | Louisville | KY | 1,228 | -12.97% |
| 28th 2000 | Tampa | FL | 1,367 | 11.32% |
| 29th 2001 | Dallas | TX | 1,293 | -5.41% |
| 30th 2002 | Birmingham | AL | 1,603 | 23.98% |
| 31st 2003 | Charlotte | NC | 1,510 | -5.80% |
| 32nd 2004 | Pittsburgh | PA | 1,357 | -10.13% |
| 33rd 2005 | Chattanooga | TN | 1,580 | 16.43% |
| 34th 2006 | Atlanta | GA | 1,415 | -10.44% |
| 35th 2007 | Memphis | TN | 1,288 | -8.98% |
| 36th 2008 | Dallas | TX | 1,185 | -8.00% |
| 37th 2009 | Orlando | FL | 1,081 | -8.78% |
| 38th 2010 | Nashville | TN | 1,311 | 21.28% |
| 39th 2011 | Virginia Beach | VA | 1,183 | -9.76% |
| 40th 2012 | Louisville | KY | 1,120 | -5.33% |
| 41st 2013 | Greenville | SC | 1,327 | 18.48% |
| 42nd 2014 | Houston | TX | 1,123 | -15.37% |
| 43rd 2015 | Chattanooga | TN | 1,396 | 24.31% |
| 44th 2016 | Mobile | AL | 1,316 | -5.73% |
| 45th 2017 | Greensboro | NC | 1,461 | 11.02% |
| 46th 2018 | Atlanta | GA | 1,536 | 5.13% |
| 47th 2019 | Dallas | TX | 1,616 | 5.21% |
| 48th 2021 | St. Louis | MO | 2,115 | 30.88% |

Recent Comments