
May 28, 2019
This report provides data tables showing the numbers of Teaching Elder (TE) and Ruling Elder (RE) commissioners enrolled at the 46 General Assemblies (GA) of the Presbyterian Church in America (PCA). The data presented show the steady enrollment growth of TE commissioners with participation each year almost always higher than the prior year. The total TE enrollment in 2018 was 1202 — the highest enrollment number ever. Conversely, the data also show a trend of decreasing participation levels of RE commissioners since their peak of 531 commissioners in 2002.
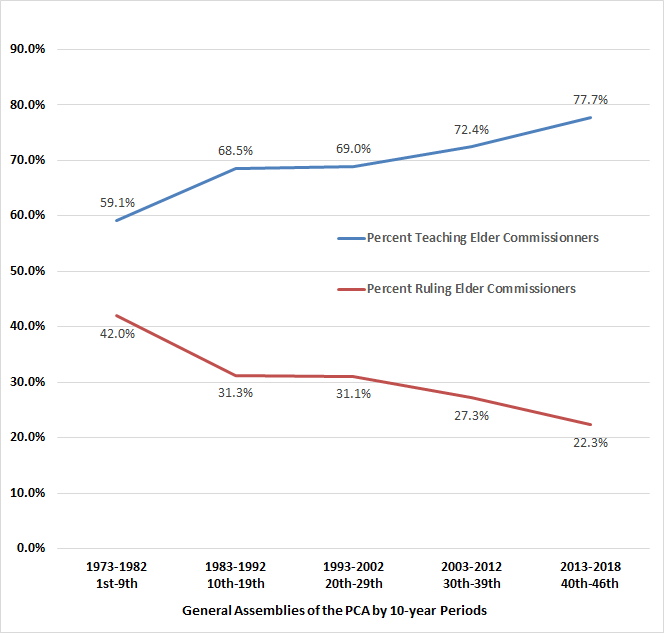
The average TE commissioner enrollment over 46 years was 765.0, and the average RE commissioner enrollment was 327.0 over that same period. The percent of TE commissioners ranged from a minimum of 46.3% to a maximum of 78.8% with an average of 68.5%. The percent of RE commissioners ranged from a minimum of 21.2% to a maximum of 53.7% with an average of 31.5%.
The percent participation of RE commissioners has decreased over every 10-year period since the first GA in 1973. In the first decade of the PCA, an average of 42% of the commissioners at the annual GA were REs. Since the 40th GA in 2014, the average RE participation at the GA of 302.7 was only 22.3% of the total commissioner enrollment. The number of REs attending GA peaked in the third decade of the denomination’s existence with an average annual enrollment of 395.5 REs from 1993-2002.
All data were taken from final count of commissioners from the Minutes of the General Assembly of the PCA. The GA minutes may be found on the web site of the PCA Historical Center: Archives and Manuscript Repository for the Continuing Presbyterian Church. The raw data in Excel format may be obtained from the author.
Table 1: Numbers of Teaching and Ruling Elder Commissioners Enrolled at the 1st through the 46th General Assemblies of the Presbyterian Church in America — 1973 through 2018.
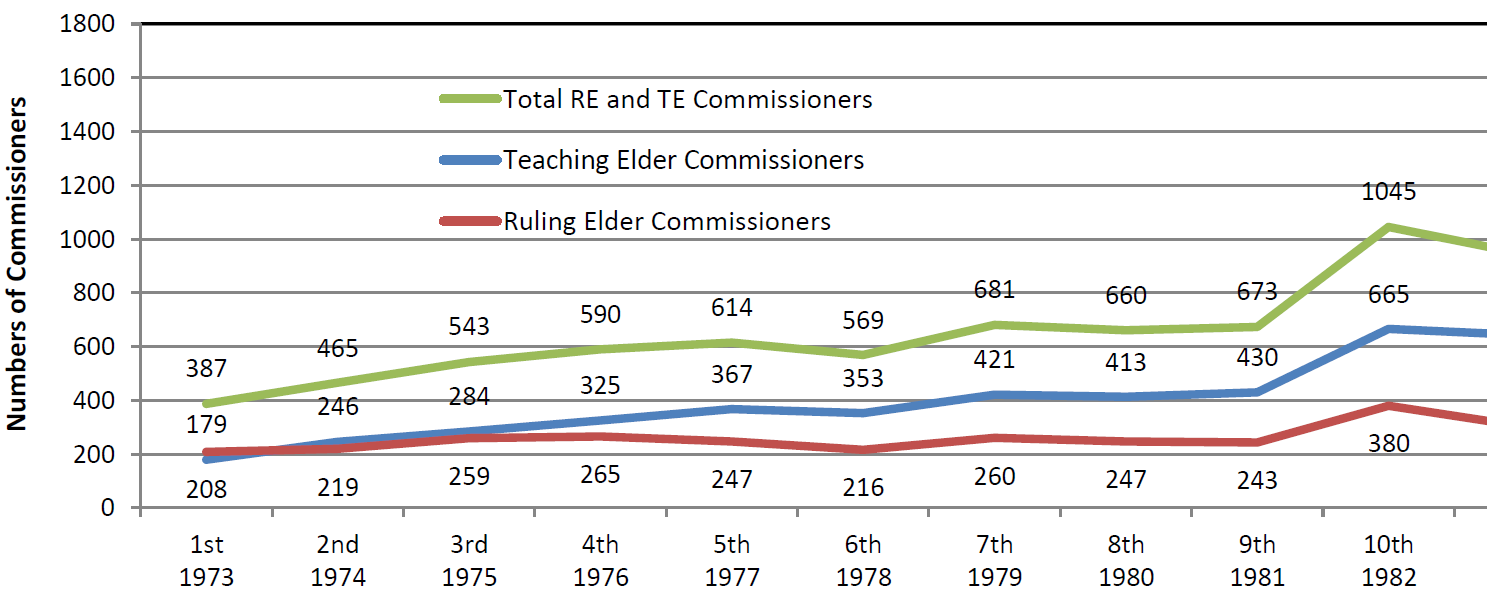
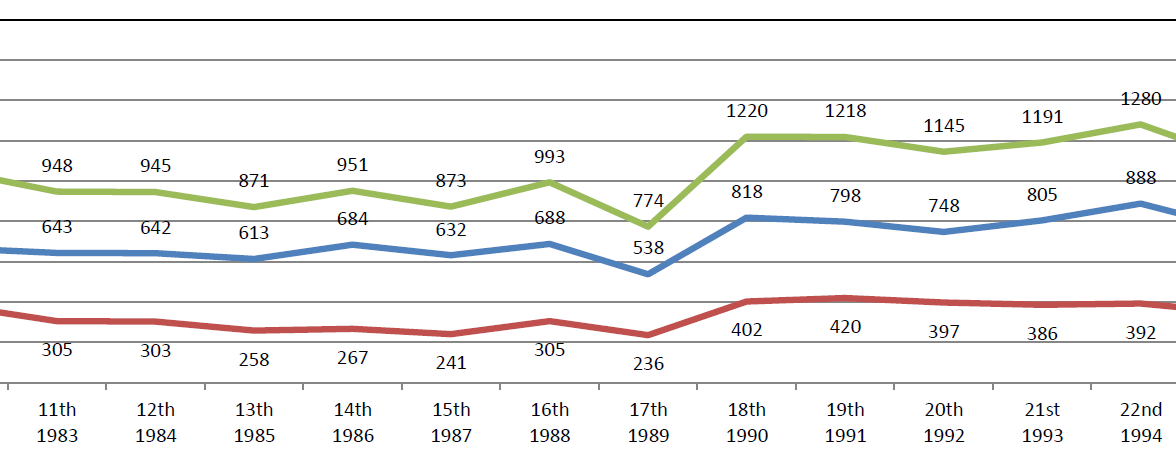
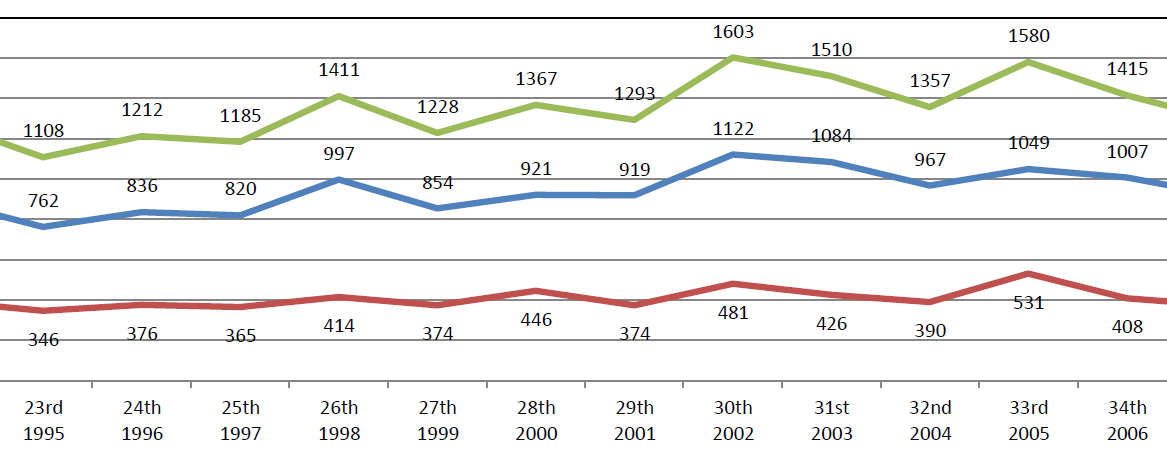
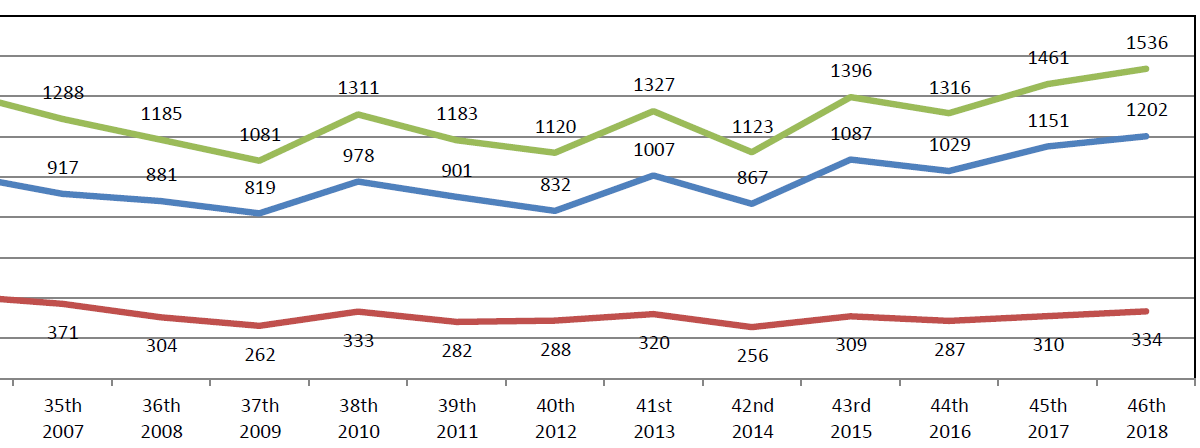
Table 2: Summary Statistics on Teaching Elder and Ruling Elder Attendance at the 46 General Assemblies of the PCA from 1973 to 2018.
| Average | Maximum | Minimum | |
| TE Commissioners | 765.0 | 1202 | 179 |
| RE Commissioners | 327.0 | 531 | 208 |
| Total Commissioners | 1092 | 1603 | 387 |
| Percent TE Commissioners | 68.5% | 78.8% | 46.3% |
| Percent RE Commissioners | 31.5% | 53.7% | 21.2% |
Table 3: Average Total Enrollment of Commissioners at PCA General Assemblies in 10-year Periods Since 1973 with the Average Numbers of Teaching and Ruling Elder Commissioners Shown Separately.
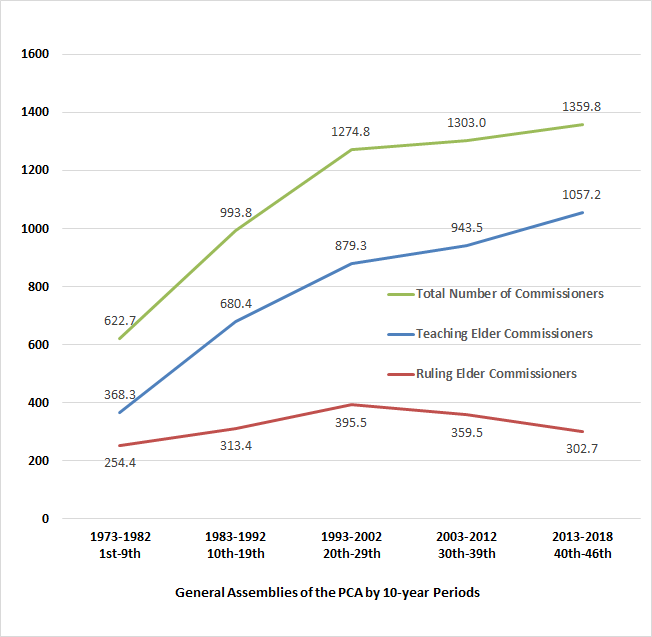
Table 4: Percent of Teaching and Ruling Elder Commissioners Enrolled at PCA General Assemblies in 10-year Periods — 1973 through 2018.

Recent Comments